If your brand is on social media, you know the importance of checking which campaigns are effective and which aren’t by checking your posting performance. It’s vital to pay attention to your brand’s social media metrics each month. Your report can provide key insights into what your audience responds well to!
But do you know the difference between reach and impressions? Sometimes, the different variables can be confusing. Follow along as we break down some of the terms you might find on your monthly social media performance report.
Different Social Media Metrics
- Engagements are the number of times your audience took action on your content
-
-
- These are measured by taking a sum of your likes, comments, shares, and saves
-
- Impressions are the total number of times your content was viewed on social media
-
- Hint: impressions can be higher than reach because the same person might look at your content more than once!
-
- Reach is the total number of people who see your content
-
- Pro-tip: pay attention to your followers vs. non-followers who are seeing your content. If a lot of non-followers see your posts, this means your content is either being shared or is performing well on the platform’s algorithm (or both!)
-
- Audience growth rate measures how many new followers your brand gets on social media within a certain amount of time.
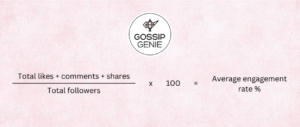
- Engagement rate measures the number of engagements your content gets as a percentage of your audience, and it can be calculated using the formula below
-
- A “good” rate varies by platform and industry, but generally, most social media experts agree that you want to see your engagement rate at 1% – 3.5%, with a high rate represented by anything larger than 3.5%
-

If you need help with building out your brand’s social media presence, contact us today! We can help build out an all-encompassing social media plan to help you meet and exceed your goals. Stay tuned for more social media insights!


